

Automated maintenance services cut downtime before faults hit the floor. Compare cost models, evaluate providers, and build a business case with a readiness checklist.
Automated Maintenance Services: How Smart Upkeep Cuts Downtime and Costs
A plant operations leader reads the overnight report at 6 a.m.: a critical line stopped sometime after midnight, a technician was dispatched hours too late, and an SLA is now in breach. Buried in the telemetry logs sits the part that stings — a vibration anomaly that had been climbing for three days, watched by no one. This is the failure mode of most maintenance budgets. They pay to react to breakdowns rather than to prevent them, and every hour of unplanned downtime compounds: lost output, emergency labor rates, cascading schedule slips, contract penalties. The scale is not marginal. Industry decision-maker surveys run by ABB show 83% believe unplanned downtime costs at least $10,000 per hour. Your live decision is straightforward and expensive to get wrong: keep running a calendar-based or run-to-failure model, or move to automated maintenance services that use sensor data and predictive models to act before a fault reaches the shop floor. What follows is a decision-grade breakdown — cost mechanics, service models, provider evaluation, and a readiness checklist — built for the person who has to sign off on the spend.
Table of Contents
- Where Your Maintenance Model Is Quietly Bleeding Money
- What Automated Maintenance Services Actually Include
- Reactive vs Preventive vs Predictive vs Fully Automated: A Cost-and-Fit Comparison
- How Smart Upkeep Cuts Downtime and Costs: The Failure-Prevention Loop
- What Separates a Real Automation Partner from a Dashboard Vendor
- Building the Business Case: Baseline and Target Metrics That Justify the Spend
- Your Automation Readiness Checklist
- Automated Maintenance Services: Frequently Asked Questions
Where Your Maintenance Model Is Quietly Bleeding Money
Most facilities run one of three legacy models, and each one leaks money in a distinct place.
Reactive maintenance (run-to-failure) is the cheapest to set up and the most expensive to operate. You fix equipment when it breaks — no sensors, no schedules, no planning overhead. The bill arrives later. Maintenance platform Oxmaint and advisory firm Wiss put median downtime costs in reactive environments around $125,000 per hour once you count emergency repairs, overtime, and the production you can't recover. That number is the price of being surprised.
Preventive maintenance (calendar-based) services equipment on a fixed schedule regardless of its actual condition. It controls catastrophic risk better than reactive does, but it substitutes a different waste: you replace parts and consume labor too early, on a clock that has nothing to do with how the asset is actually wearing. Ramesh Gulati, CMRP and author of Maintenance and Reliability Best Practices, has long argued that traditional preventive programs drive over-maintenance and unnecessary part replacement, while condition-based and reliability-centered approaches target critical assets and real failure modes. Servicing a bearing that had 4,000 good hours left is money burned just as surely as letting it seize.
The gap both models share is the important one. Neither watches the asset's real-time condition, so both are always mistimed — reactive acts too late, preventive acts too often. Automation fills exactly that gap by making the intervention condition-driven rather than calendar-driven or crisis-driven.
A maintenance calendar assumes machines fail on schedule. They never have.
The financial exposure is large and widely documented, though it varies enormously by context. Industrial IT services firm AlphaCIS, maintenance software provider Innovapptive, and IT resilience provider Info2soft put typical unplanned downtime costs between $2,000 and over $50,000 per hour for many facilities, climbing to $100,000–$300,000+ per hour for large automotive and semiconductor plants. Cross-industry analysis from Info2soft, summarizing Aberdeen Group and Siemens data, sets the average near $260,000 per hour, with some automotive lines losing up to $2.3 million per hour. Aggregate the whole sector and the figure climbs to roughly $50 billion annually in unplanned downtime costs for industrial manufacturers, according to manufacturing analytics company Fourjaw and Wiss.
The perception gap is the more revealing data point. According to ABB's global industrial downtime survey, 83% of decision-makers believe downtime costs at least $10,000 per hour and 76% estimate it can reach up to $500,000 per hour — yet one in three businesses had not modernized their motor-driven systems in the previous two years. Organizations know the number and still don't act on it.
A word of caution before you build a business case on any of these averages. Headline figures like "$260,000 per hour" mask huge variance by sector, plant size, and product mix, and Info2soft and AlphaCIS both warn they produce overstated ROI when applied without plant-specific baselines. Many plants also under-account the hidden costs — restart losses, contract penalties, IT/OT disruption — which means a borrowed average can be wrong in both directions. A real, measured baseline is not optional; the metrics section returns to exactly how to build one.
The barriers to fixing this, notably, are not analytical. ABB's data makes clear the business case is usually understood. What stops adoption is capital constraints, legacy assets that don't emit clean data, organizational inertia, and skills gaps on the plant floor.
What Automated Maintenance Services Actually Include
Automated maintenance services are not a single product — they are a stack of capabilities you assemble, and knowing what sits at each layer keeps you from buying a dashboard and calling it a program. Here is what the buyer is actually purchasing.
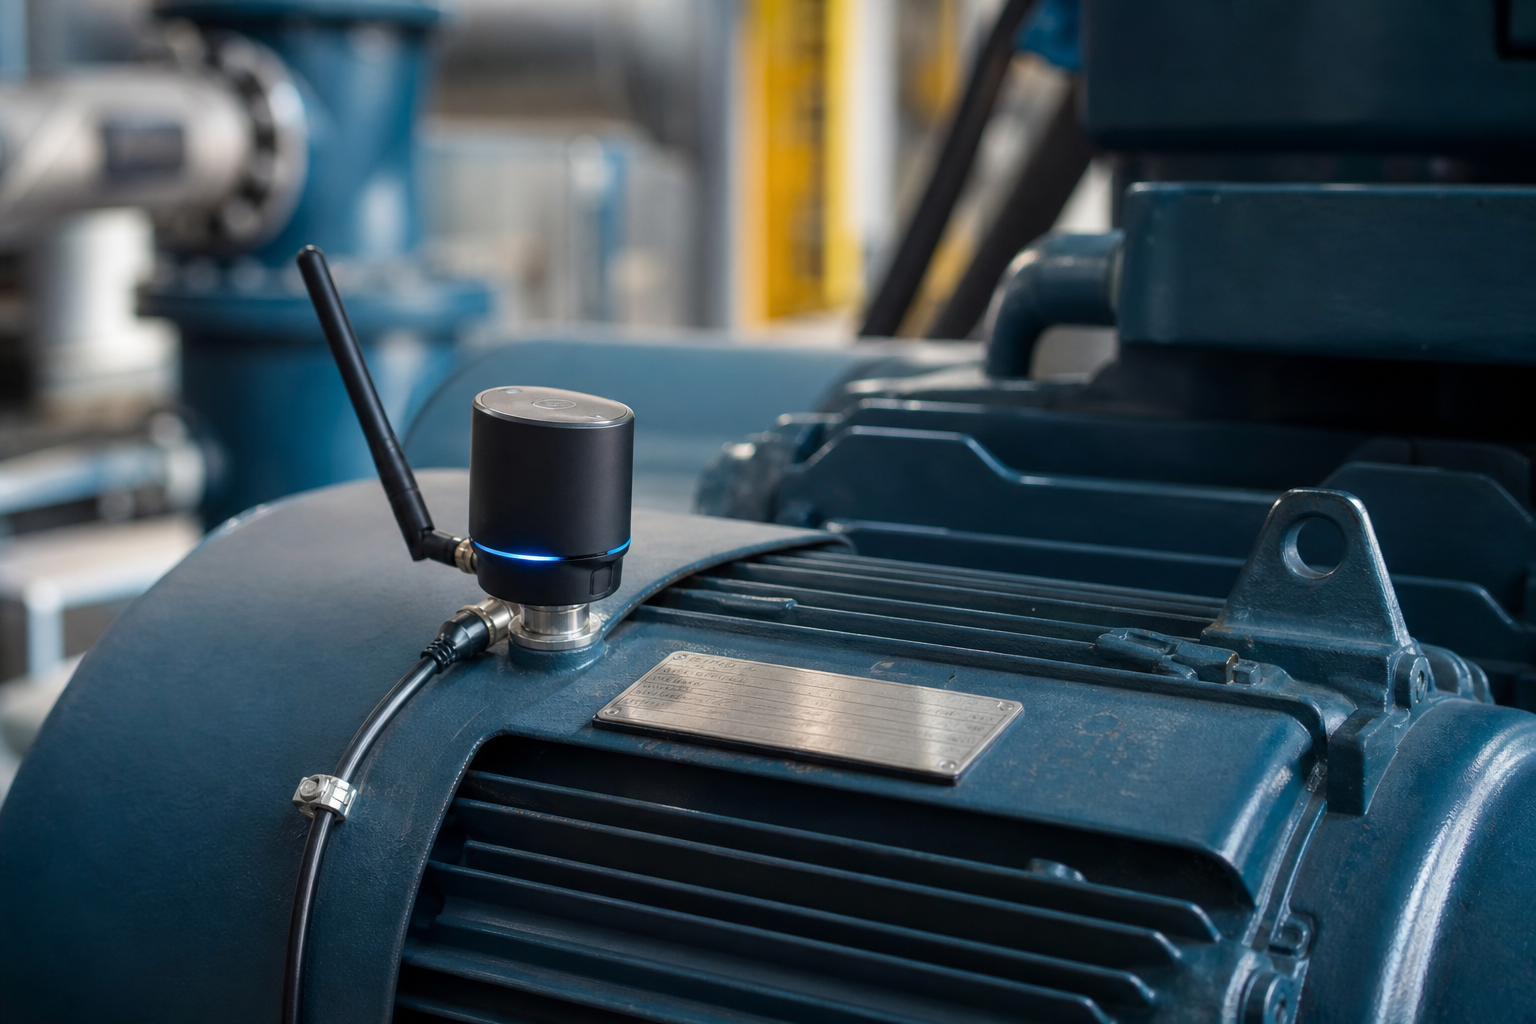
Condition monitoring — the sensing layer. This is IoT sensors and telemetry ingestion capturing the parameters that machine diagnostics depend on. According to ISO 17359:2018, the international standard for condition monitoring and diagnostics of machines, those parameters are vibration, temperature, tribology (oil and wear-particle analysis), and flow rate. This layer is the foundation. If sensor coverage is thin or the wrong parameters are captured, everything downstream degrades — you cannot predict a failure mode you never measured.
Predictive analytics — the forecasting layer. Machine-learning models forecast failure windows and remaining useful life from the condition data. This is the domain of prognostics and health management (PHM), a discipline associated with Dr. Michael Pecht of the Center for Advanced Life Cycle Engineering at the University of Maryland. PHM depends on continuous condition monitoring combined with physics-of-failure models, and Pecht's work is emphatic that accuracy hinges on data quality, sensor selection, and model validation. A well-built model catches drift early; a poorly validated one misclassifies risk and trains your technicians to ignore it. This is where the AI modeling work either earns its keep or quietly undermines the whole program.
Automated work-order triggering — the action layer. This is integration with your CMMS or ERP so a predicted fault opens a work order, reserves or orders the part, and schedules a technician without anyone retyping an alert. Automation at this layer is the line between insight and outcome — it removes the human latency that turns a three-day warning into a missed SLA.
Remote diagnostics and self-healing routines. Software-side automation that resets, reconfigures, or throttles equipment before a physical dispatch is even necessary. Not every fault needs a technician; some need a controlled parameter change the system can execute itself.
Reporting and compliance dashboards. Condition indices, risk scores, and audit trails that map to your asset-management obligations and give leadership a defensible record of decisions.
Owning the sensor and the dashboard is not the same as owning the outcome. That distinction runs through the provider-selection section, because it is where most programs quietly fail.
Reactive vs Preventive vs Predictive vs Fully Automated: A Cost-and-Fit Comparison
| Approach | Upfront cost | Ongoing cost driver | Unplanned downtime risk | Typical best fit |
|---|---|---|---|---|
| Reactive (run-to-failure) | Low | Emergency repairs, overtime, ~$125K/hr median outage | Highest | Non-critical, cheap-to-replace assets |
| Preventive (calendar) | Low–moderate | Over-servicing: early parts + labor | Moderate | Stable, well-understood assets |
| Predictive (condition-based) | Moderate–high | Sensors + analytics + skilled interpretation | 30–50% lower than reactive | Critical assets with failure history |
| Fully automated | High | Integration + model upkeep | Lowest; auto-dispatch closes loop | High-value lines where downtime is catastrophic |
Reactive maintenance is only defensible on cheap, redundant, non-critical assets — the kind you can afford to let run to failure because the replacement costs less than the monitoring would. Preventive maintenance controls catastrophic risk on stable, well-understood equipment, but you pay for that safety through over-maintenance every service cycle.
The distinction most buyers miss sits between the last two columns: predictive is not automatically automated. Predictive maintenance tells you a failure is coming. Fully automated maintenance acts on it — triggering the work order, reserving the part, and scheduling the technician without a human in the loop. Many programs branded "predictive" stall precisely here. They generate accurate alerts that land in an inbox nobody wires to action, and the insight expires before anyone acts on it.
The ROI evidence for going all the way is strong where the data supports it. Wiss and industrial solutions provider KGT Solutions report 18–25% maintenance cost reductions and 30–50% fewer unplanned stoppages for predictive-plus-automated programs versus reactive baselines. In high-cost automotive environments, KGT and Wiss put ROI between 10:1 and 30:1, driven by the fact that each avoided downtime hour can recover roughly $2.3 million on some lines.
Read those as ceiling figures, not promises. Realized savings depend on data quality and integration depth — the two variables the next sections address directly.
How Smart Upkeep Cuts Downtime and Costs: The Failure-Prevention Loop
Automated maintenance services cut cost and downtime through a closed loop, and the useful way to understand it is to ask, at each step, where the money is actually saved.
- Data capture. Sensors stream vibration, temperature, tribology, and flow at defined collection intervals — ISO 17359 formalizes both the parameter selection and the intervals. Cost lever: none yet. This is the foundation, and poor coverage caps every saving downstream. You cannot recover what you never measured.
- Anomaly detection. Models flag deviation from a healthy baseline. Cost lever: this catches drift days before failure — the climbing vibration signal from the 6 a.m. report — while there is still time to plan around it rather than react to it.
- Failure prediction. Prognostics estimate remaining useful life and a failure window. Cost lever: this converts "something's wrong" into "act within X days," which lets you schedule the intervention around production instead of stopping the line to investigate.
- Automated dispatch and work order. The CMMS or ERP auto-generates the order, reserves the part, and schedules the technician. Cost lever: this is the exact point where predictive becomes automated. It removes the human-latency gap — the hours between an alert firing and a person acting on it — that breaches SLAs and turns manageable faults into outages.
- Verification. Post-repair sensor data confirms the fault actually cleared. Cost lever: this prevents repeat dispatches and false "fixed" statuses that send a technician back to the same asset twice.
- Model refinement. The outcome feeds back to sharpen the next prediction. Cost lever: this steadily reduces false alarms, which is not a cosmetic gain — Wiss and KGT both tie eroded ROI directly to alert fatigue and the low technician adoption it causes.
The saving isn't the repair you make cheaply. It's the failure that never reaches the shop floor.
Dr. Jay Lee, founder of the Center for Intelligent Maintenance Systems at the University of Cincinnati, frames the shift as moving from time-based to performance-based maintenance, pushing toward near-zero downtime. His central point maps cleanly onto step four: the business case hinges on linking condition data directly to timely, automated interventions — not on producing more dashboards for people to watch.

What Separates a Real Automation Partner from a Dashboard Vendor
Choosing a provider is where good intentions meet poor outcomes. These are the criteria that predict whether a program delivers the savings above or joins the pile of stalled pilots.
Integration depth. Does the system wire into your existing ERP, SCADA, and CMMS, or does it sit in a silo? The research is blunt on this. Wiss and KGT both report that programs stall when they deliver insight but never trigger seamless, automated work orders. A siloed dashboard is where ROI goes to die — it generates alerts no downstream system consumes. Custom software development to bridge those integration points is frequently the difference between a live loop and an expensive screen.
Custom modeling versus off-the-shelf thresholds. Generic alarm thresholds misclassify risk on non-standard assets, because a threshold tuned for a textbook pump means little for your specific duty cycle and mounting. This is Pecht's point applied commercially: model validation and sensor selection determine whether the program earns trust or breeds false alarms and the alert fatigue that follows.
Cross-domain engineering under one roof. Real automation spans AI models, automation and control integration, and cybersecurity — because a telemetry pipeline that feeds automated dispatch is now an attack surface, and IT/OT disruption is a documented hidden cost of downtime. A partner who owns all three layers closes gaps a single-discipline vendor leaves open. Building the cybersecurity into the pipeline from the start, rather than bolting it on after an incident, is the difference between a defensible system and a liability.
Scalability across sites and asset classes. A pilot that works on one pump must generalize to a fleet of pumps, then to compressors and motors, without re-engineering the approach from scratch each time. Ask how the modeling and integration transfer before you commit to a first site.
Ownership of outcomes versus software licensing. Does the provider commit to downtime and cost outcomes, or license you a screen and walk away? The answer tells you where accountability sits when the numbers don't move.
A dashboard tells you something broke. An automation partner makes sure the fix was already in motion.
Building the Business Case: Baseline and Target Metrics That Justify the Spend
Before you model savings, you have to know what an hour of downtime actually costs your assets. AlphaCIS and Fourjaw both use a four-component formula worth committing to memory:
Downtime cost per hour = lost production value + labor cost + overhead allocation + recovery cost (restart time × hourly operational cost).
Measure that per asset class, not by borrowing a headline average — this is the direct fix for the variance problem raised earlier. A mid-sized line and a semiconductor tool do not share a number, and a restart-heavy process can spend more on recovery than on the outage itself.
| Metric | What it measures | Baseline to capture | Target after automation |
|---|---|---|---|
| Unplanned downtime hours | Total lost production time | Current annual hours | 30–50% reduction |
| Maintenance cost per asset | Total spend / asset | Current $/asset | 18–25% reduction |
| MTBF | Mean time between failures | Current interval | Increase |
| MTTR | Mean time to repair | Current average | Decrease via auto-dispatch |
| OEE | Availability × performance × quality | Current % | Increase |
| Emergency-labor ratio | Emergency vs planned labor | Current split | Shift toward planned |
The reduction targets trace to Wiss, Oxmaint, and KGT data; the reliability framework of MTBF, MTTR, and OEE traces to asset-management practice codified in ISO 55000 and detailed in AISTech's technical work on aligning ISO standards in asset performance management.
Anchoring the metrics to a standard matters when you defend the spend upward. Per the ISO 55000 asset management framework, maintenance decisions should align with organizational objectives, performance, risk, and cost — and the framework emphasizes tracking OEE alongside MTBF, MTTR, and condition indices. That gives you a recognized structure to present maintenance investment as asset strategy rather than a cost-center request.
Phase the rollout to match reality. Capture a clean baseline, run one high-impact pilot, prove value against these metrics, then scale. That sequence is the realistic path given the capital constraints and organizational inertia the ABB data flagged — it lets you show a real number before you ask for the fleet-wide budget.
Your Automation Readiness Checklist
Run this audit before you engage any provider. It maps the terrain a serious program has to cover, and it surfaces the gaps that quietly sink pilots.
- Inventory critical assets and pull their failure history. You cannot monitor what you haven't ranked. ISO 17359 rates assets by cost of downtime, failure rate, MTTR, redundancy, and consequential damage — use those exact factors to prioritize which equipment earns sensors first.
- Flag which assets already emit usable telemetry. Existing sensor and PLC data lowers your upfront cost immediately; the gaps tell you precisely where retrofit sensors are needed and what that will cost.
- Establish a downtime-cost baseline per asset class using the four-component formula, not a borrowed industry average. This baseline is the denominator for every ROI number you will later report.
- Audit your CMMS and ERP integration points. Automated dispatch only works if the systems talk. Identify the APIs, the data owners, and the integration debt now, because this is where "predictive" programs most often fail to become automated ones.
- Define one high-impact pilot line or asset where a proven 30–50% downtime reduction produces visible ROI fast. Pick something consequential enough that success is undeniable and contained enough that failure is survivable.
- Set success metrics and a review cadence. Lock in MTBF, MTTR, unplanned downtime hours, maintenance cost per asset, OEE, and emergency-labor ratio against a fixed checkpoint — a 90-day review is a sensible first gate.
Work through that list and the shape of the problem becomes clear: it demands AI modeling, automation and CMMS integration, and cybersecurity for the data pipeline at the same time, on the same assets. That simultaneity is exactly where a single-discipline vendor falls short. Lagodish Tech spans those layers as one partner, which is the practical requirement for turning automated maintenance services from a dashboard into an outcome.
Automated Maintenance Services: Frequently Asked Questions
Do automated maintenance services require replacing existing equipment?
No. Most programs retrofit wireless IoT sensors onto existing assets rather than rip and replace. This matters more than it sounds — ABB's survey found a third of businesses hadn't modernized motor systems in two years, largely because of the capital wall of full replacement. Retrofit sensing is precisely how you sidestep that wall and start capturing condition data on machinery you already own.
How long before automated maintenance shows measurable ROI?
Plants scaling predictive and automated monitoring report 35–50% fewer unplanned stoppages within 12 months, with ROI of 10:1 to 30:1 in high-cost environments, according to KGT and Wiss. The timeline depends heavily on data quality and whether you captured a clean baseline first — without the baseline, you have improvement you can't prove.
Is our operation too small to justify automated maintenance services?
Not necessarily. Selective automation on your one or two highest-consequence assets is often high-leverage even when a full rollout isn't justified. The gating factor is downtime cost per asset, not plant size — a small operation with one catastrophic-if-it-stops line can have a stronger case than a large plant of redundant, cheap-to-replace equipment.
How is sensor and telemetry data secured against tampering or breach?
This is a live risk, not a hypothetical. A pipeline that triggers automated action is an attack surface, and IT/OT disruption is a documented hidden cost of downtime. Data has to be encrypted in transit, access-controlled, and monitored for anomalies — which is why security belongs inside the maintenance program from the design stage rather than bolted on after an incident forces the conversation.